Inside the #MarRef trenches
Following on from my #MarRef tweet dataset post, I thought of some additional things that might be cool to look at and I’m going to share them here.
That dataset consisted of 229,563 #MarRef tweets from 43,501 tweeters. In the previous post one of the things listed is the top 50 tweeters. I thought it might be interesting to look at tweeters directly and see if they had some interesting trends.
“Vote Yes”, “#VoteNo”, “#YesEquality”, etc…
I labelled tweeters with their likely voting preference, that I judged from reading their tweets. To maximise the number of tweets for any later analyses I worked in descending order of number of tweets. I reached 208 likely Yes voters and 38 No voters before it became too tedious. I came across 17 accounts for which likely voting preference couldn’t be determined or was a neutral news account, etc, and so were excluded.
These numbers support Twitter being more liberal about same-sex marriage, with 85% of the most vocal #MarRef tweeters leaning Yes compared to 62% of the Irish public voting Yes. (Prehaps this could be biased by young people who are more likely to be in favour of same-sex marriage also tweeting more often? So not only are there more young people than average on Twitter but they also tweet more?)
Mapping Trenches
One of the first things I wondered was if the accounts that tweeters follow would match their voting preference. So I gathered accounts that tweeters followed, again in descending order based on number of #MarRef tweets. This collection is still ongoing due to very restrictive Twitter API rate limiting but at time of writing I’ve collected following data for over 24k of the 43.5k tweeters, which is more than enough. In fact, these 24k tweeters account for over 200k of the 229k #MarRef tweets.
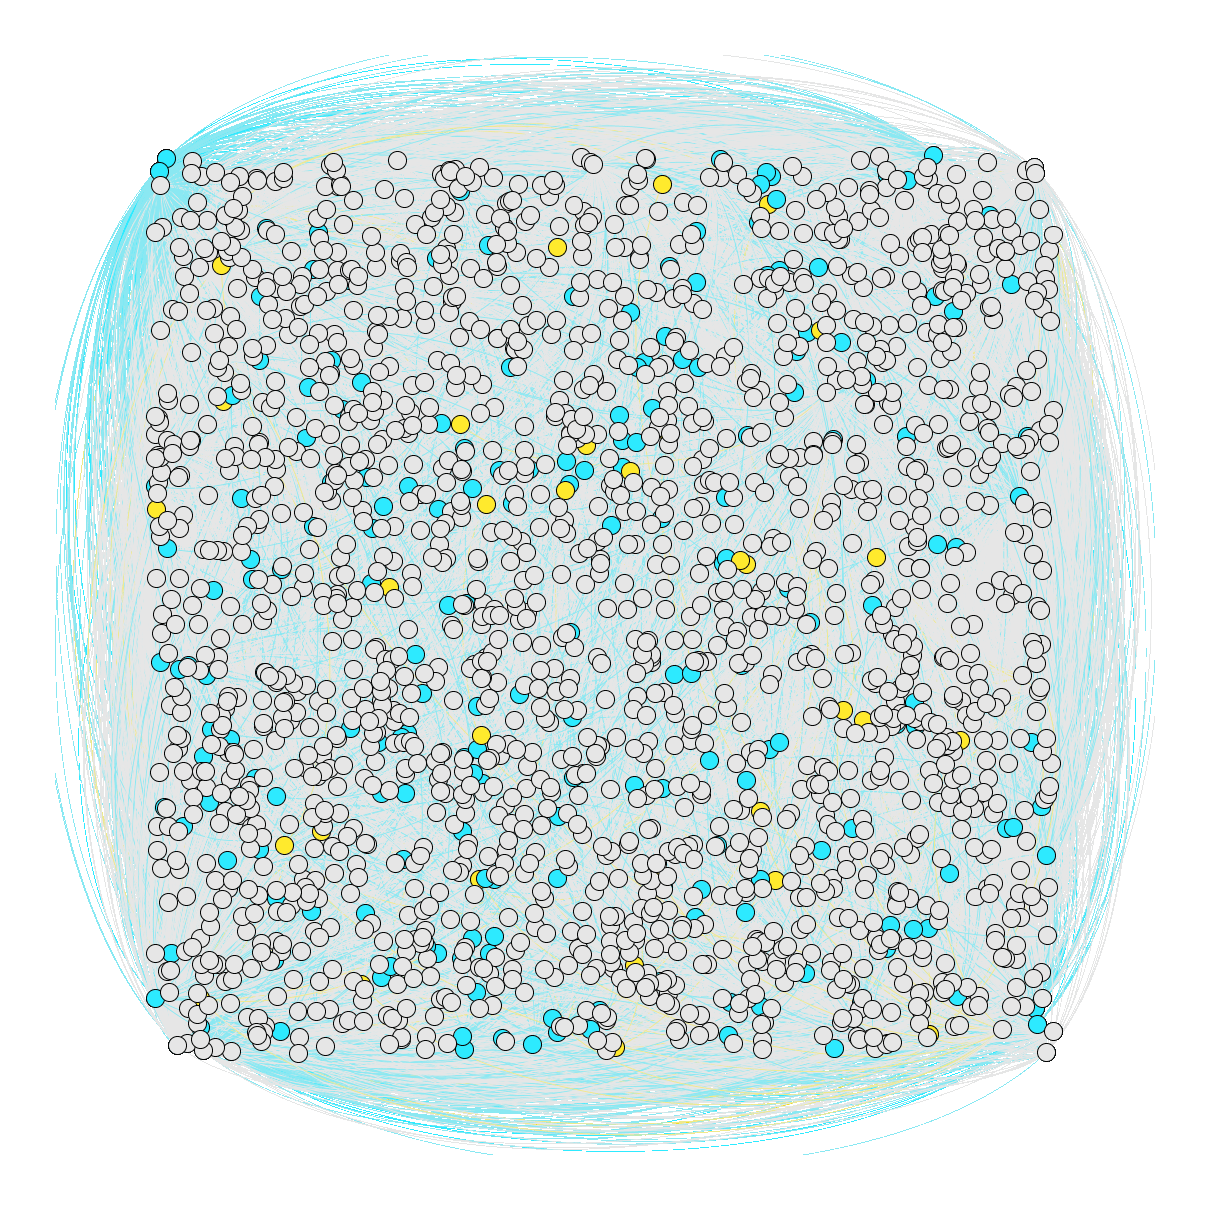
Selecting 1,975 top tweeters and graphing them as a network produced the above figure with the edges (lines connecting them) representing accounts following other accounts displayed here. This should really be a directed graph but it doesn’t really matter here. Tweeters labeled as likely yes votes are in blue, likely no voters are in yellow and others are white.
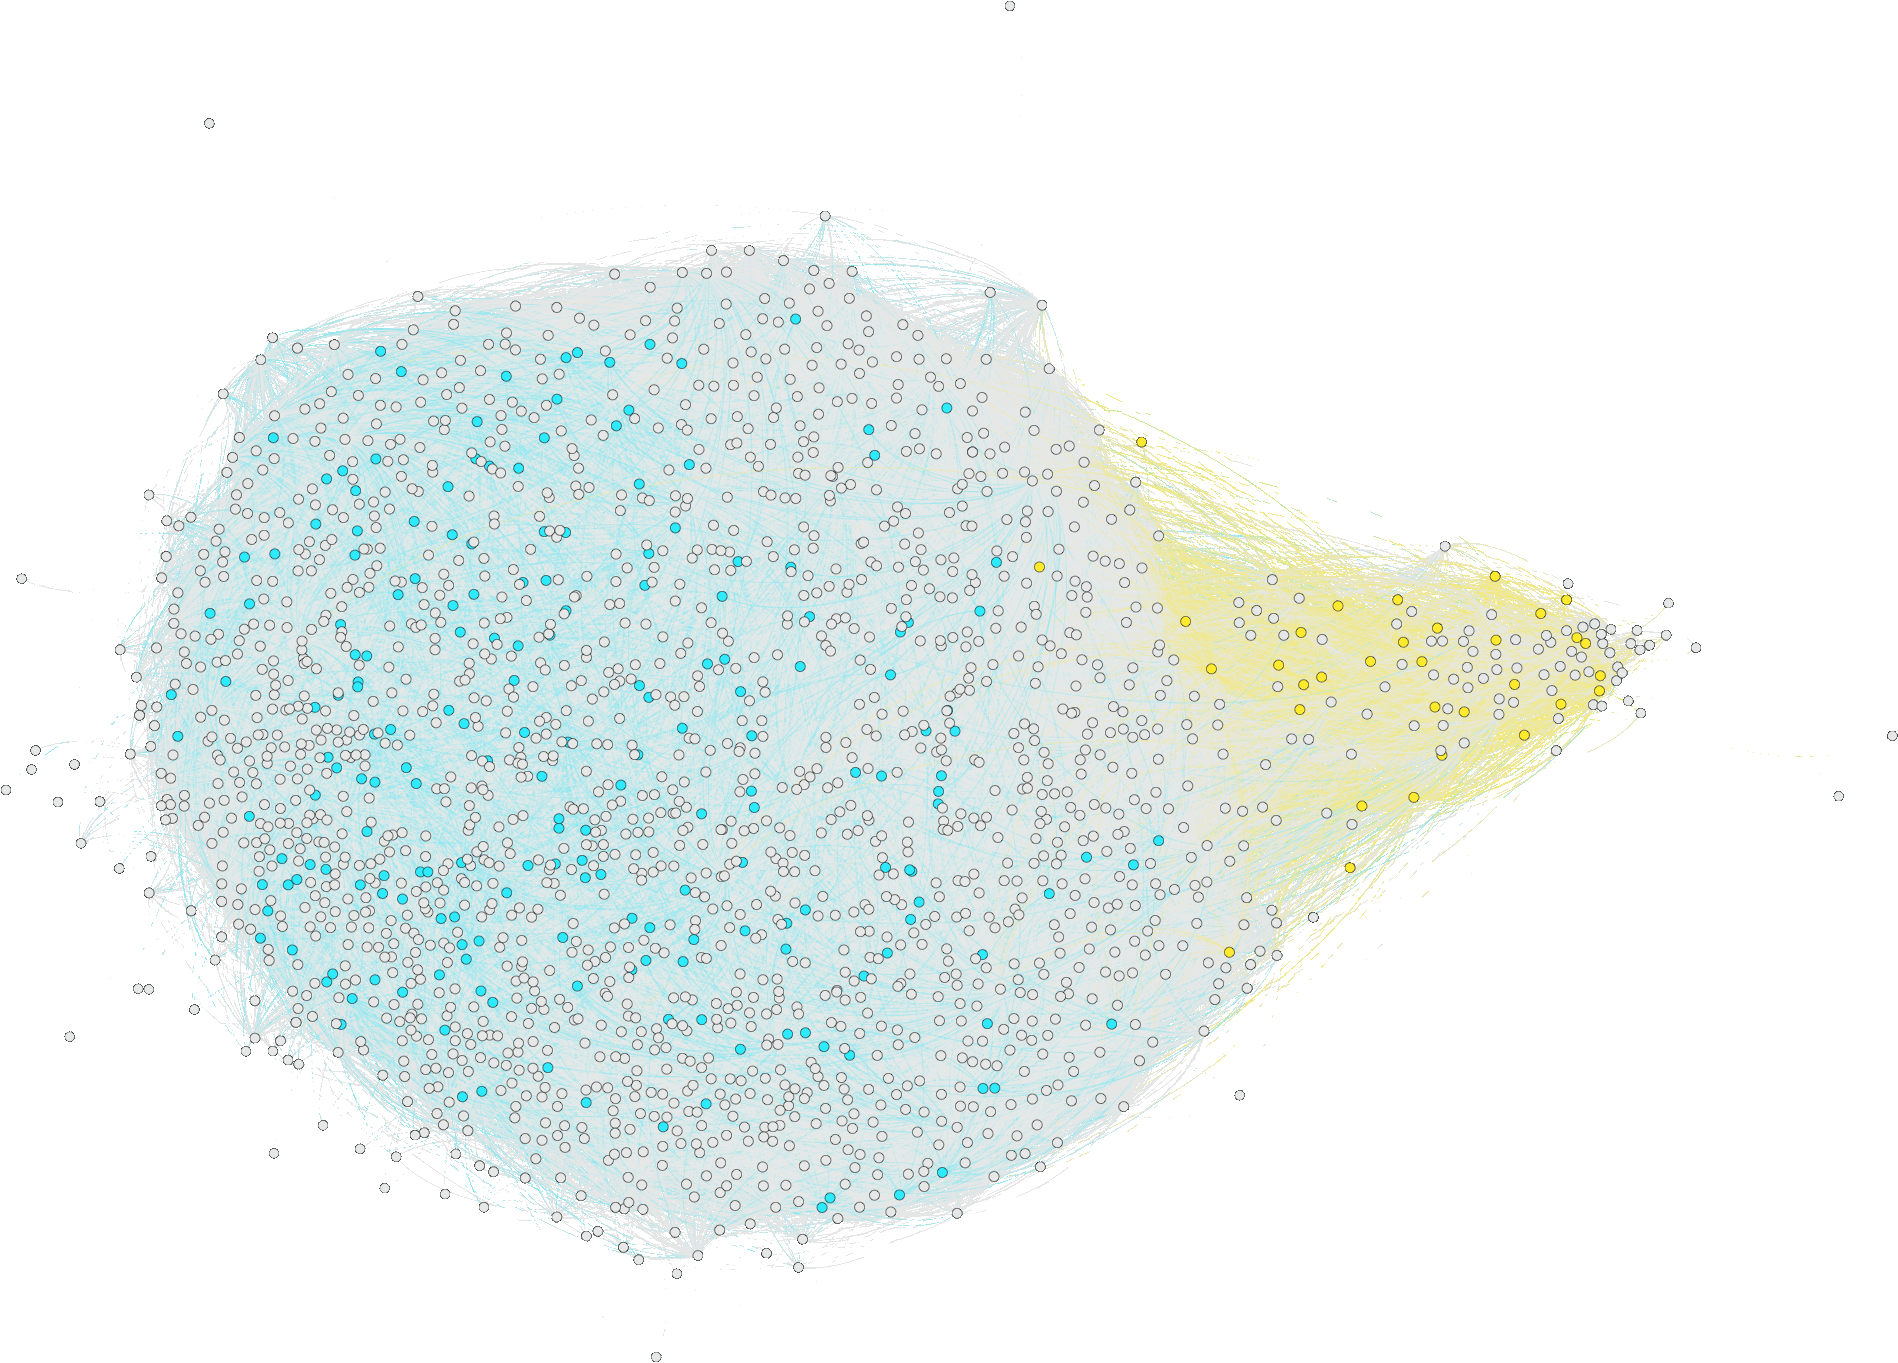
The ForceAtlas2 algorithm attempts to space out nodes so that there is minimal edge overlap and after a few hundred iterations produced the above layout. There is very clear separation between yes and no voters (no voters clustering to the right, yes to the left). This network suggests that while yes and no voters follow others on the opposing side, they seem more likely to follow other tweeters that agree with their voting preference.
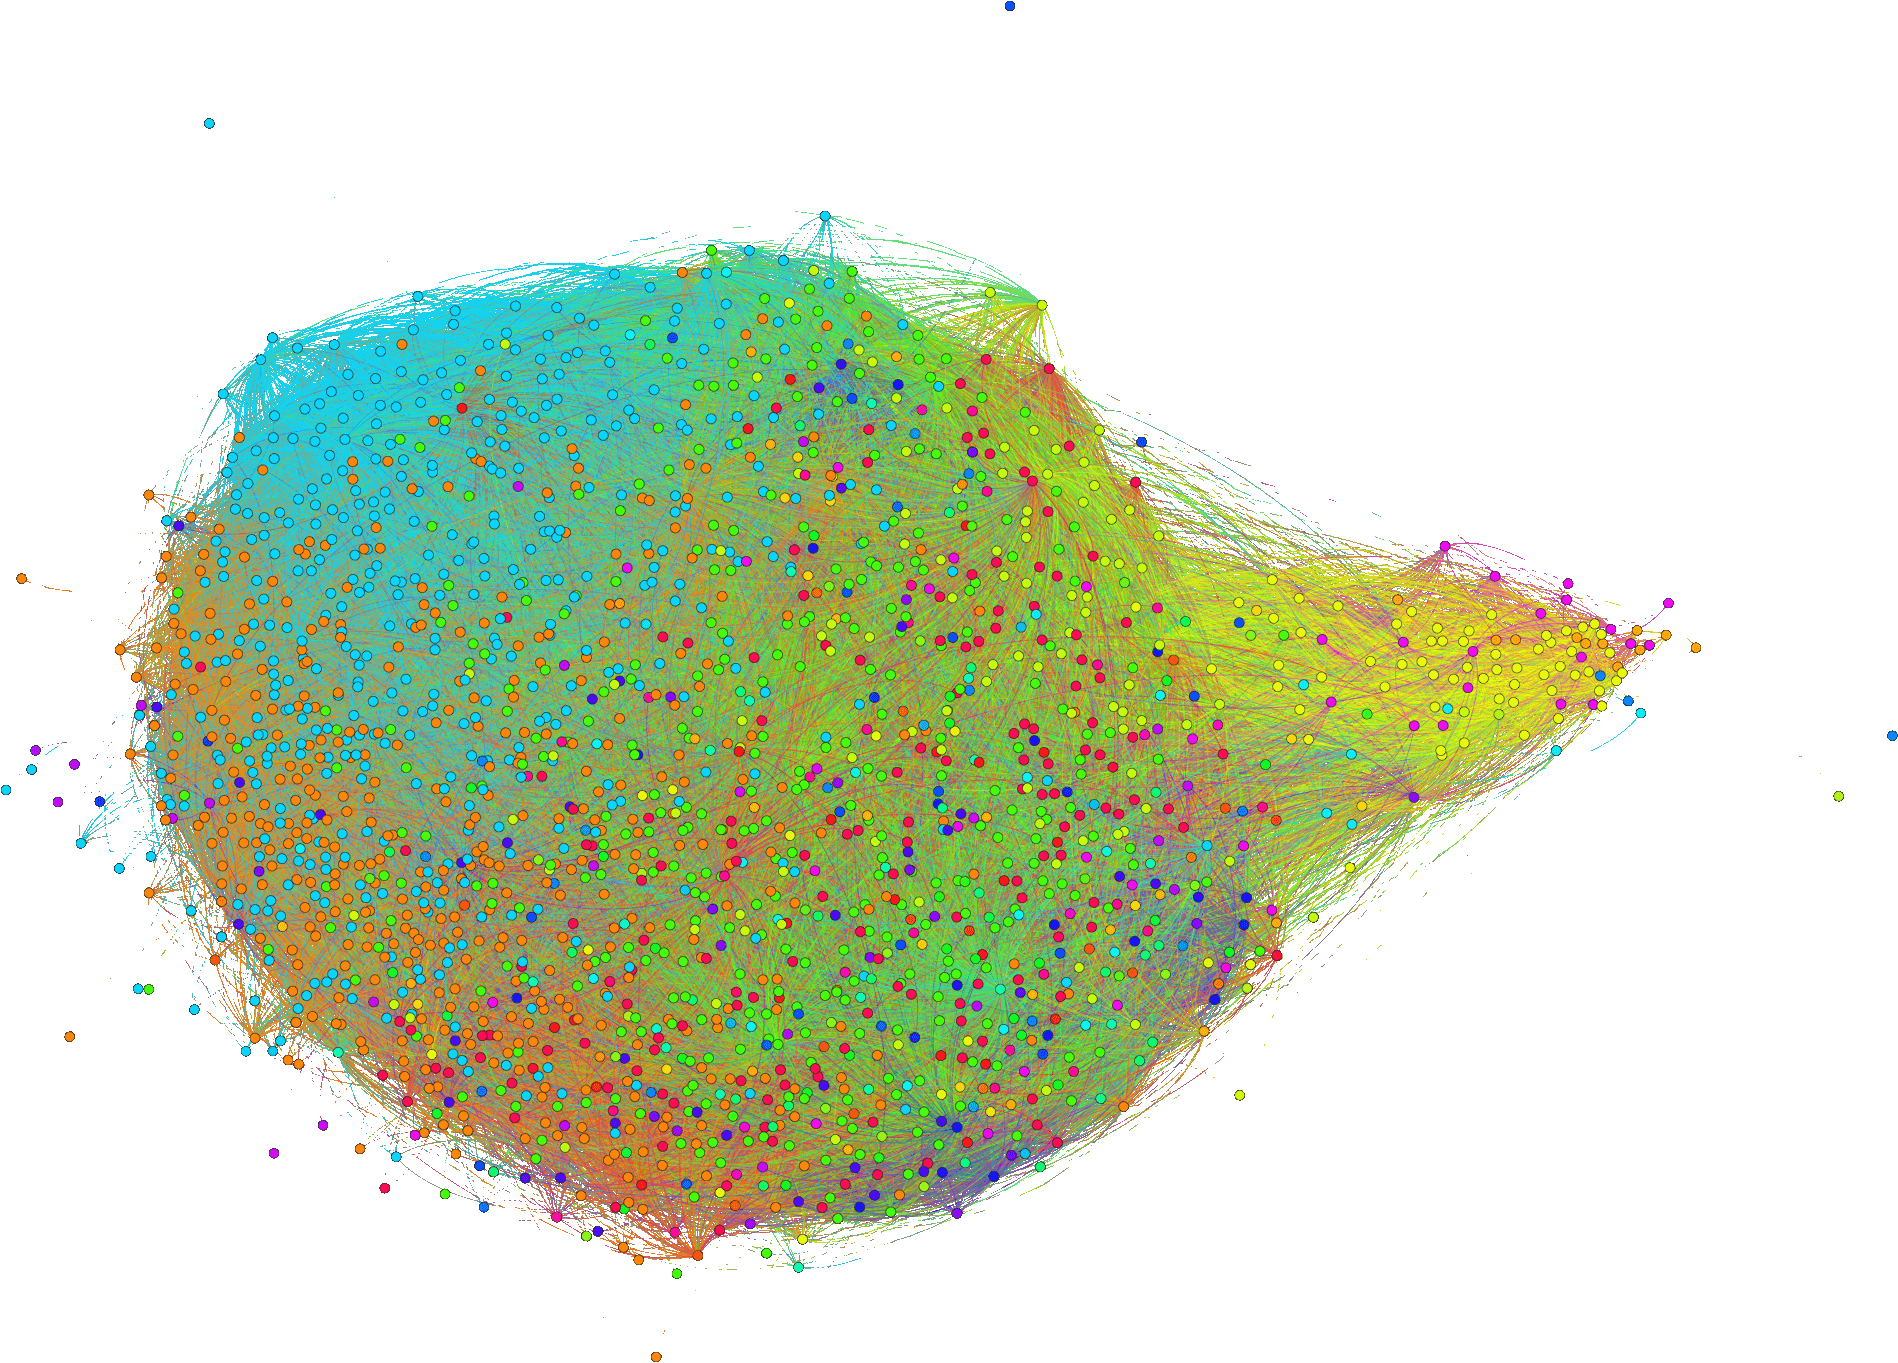
While it was tempting just to draw circles around the blue blob and yellow blob and compare and contrast each, I tried to be a little smarter and use the Markov Cluster Algorithm. Essentially it clusters nodes based on the assumption that random walks along edges will rarely lead it to travel between different clusters. So if it begins in the group of yellow no voters, it’s more likely to stay in the yellow group than it is to wander off into the larger blue group and vice versa. The results of the clustering were a little less clean than I would have liked but it worked pretty well. It produced 366 clusters, with 13 clusters containing 5 or more tweeters (listed in the table below).
| Cluster # | # tweeters | # Yes | # No | Called as |
|---|---|---|---|---|
| 8 | 445 | 68 | 0 | Yes |
| 305 | 409 | 50 | 0 | Yes |
| 6 | 316 | 39 | 0 | Yes |
| 109 | 142 | 4 | 1 | - |
| 90 | 91 | 2 | 0 | - |
| 22 | 61 | 0 | 15 | No |
| 18 | 22 | 1 | 0 | - |
| 2 | 19 | 0 | 5 | No |
| 51 | 11 | 0 | 4 | No |
| 174 | 9 | 0 | 0 | - |
| 118 | 7 | 0 | 1 | - |
| 24 | 6 | 1 | 0 | - |
| 7 | 5 | 1 | 0 | - |
| … | … | … | … | … |
Looking at the numbers of handlabelled yes and no voters in each, I’m calling clusters 8, 305 and 6 as being yes voters and clusters 22, 2 and 51 as no voters. Using this clustering method I gain 1,013 likely yes voters and 67 no voters. So combined with my handlabelled 208 Yes voters and 38 No voters, I now have 1,221 total Yes voters and 105 No voters to analyse going forward.